How to connect business outcomes, user behaviour, and system design without turning architecture into dashboard-driven guesswork
Architecture is often justified with technical language:
– scalability
– resilience
– decoupling
– performance
– modularity
– future flexibility
These qualities matter. They are not product outcomes.
A system can be elegantly decomposed, highly available, and operationally sophisticated while failing to improve anything users or the business actually value.
The opposite failure is also common. Teams watch a high-level product metric such as conversion or retention and jump directly to a technology decision:
“Conversion is low, so we need real-time architecture.”
“Engagement is down, so we need personalization.”
“Support contacts are high, so we need AI automation.”
The missing step is causal reasoning.
A product metric does not choose an architecture. It reveals a behaviour or constraint that the architecture may influence.
The core principle is:
Architecture should be treated as a hypothesis about how a system capability will move a meaningful metric.
1. WHY METRICS AND ARCHITECTURE OFTEN FAIL TO CONNECT
Product teams and engineering teams frequently operate with different metric languages.
Product metrics include:
– activation
– conversion
– retention
– task completion
– customer satisfaction
– revenue
– repeat usage.
Engineering metrics include:
– latency
– availability
– error rate
– throughput
– queue lag
– saturation
– change failure rate
– infrastructure cost.
Both sets are useful. Neither is sufficient by itself.
The connection is usually hidden in the middle:
– a user behaviour
– an experience quality
– a system mechanism.
For example:
Product outcome:
More customers complete checkout.
Behaviour signal:
Fewer customers abandon during payment confirmation.
Experience signal:
The confirmation step returns quickly and clearly.
System mechanism:
Parallel downstream calls, timeouts, graceful degradation, and idempotent retries.
Technical indicators:
P95 latency, timeout rate, payment-state ambiguity, and retry volume.
Without this chain, the organization may optimize a technical signal that does not matter or react to a product metric without understanding its cause.
2. THE METRIC LADDER
A useful metric system has five layers.
Product outcome
What valuable result does the user or business receive?
Behaviour signal
What user behaviour indicates movement toward the outcome?
Experience signal
What did the user experience while attempting the task?
System mechanism
Which technical capability influences that experience?
Technical indicator
Which operational signals reveal whether the mechanism is working?
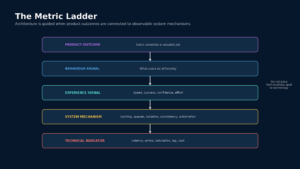
Figure 1. Product outcomes guide architecture only when they are connected to behaviour, experience, system mechanisms, and technical indicators.
The HEART framework developed at Google provides a related goal-signal-metric discipline for measuring user experience across happiness, engagement, adoption, retention, and task success.[1] The important idea is not the acronym. It is the refusal to begin with whatever telemetry happens to exist.
Start with a goal.
Identify observable signals.
Then choose metrics.
Architecture teams should use the same discipline.
3. ARCHITECTURE DECISIONS ARE METRIC BETS
Every meaningful architecture decision contains an implicit prediction.
Introducing a cache predicts:
– repeated reads exist
– the source is expensive enough to avoid
– bounded staleness is acceptable
– hit rate will justify the added complexity.
Introducing an event stream predicts:
– asynchronous processing improves the workflow
– consumers benefit from independent scaling or replay
– eventual consistency is acceptable
– event ownership can be governed.
Introducing a platform workflow predicts:
– repeated friction exists across teams
– a common path can absorb it
– self-service will be adopted
– the platform reduces time or cognitive load.
Write these predictions down.
A decision record should include:
– target product outcome
– expected user behaviour change
– system mechanism
– leading technical indicators
– guardrail metrics
– evidence threshold
– review date.
This makes architecture falsifiable.
Without a review condition, an architecture decision becomes permanent before its value is known.
4. METRICS DO NOT SELECT TECHNOLOGIES
A metric such as “time to value” does not automatically imply one implementation.
Suppose new customers take too long to activate.
Possible causes include:
– manual verification
– unclear onboarding
– slow data import
– too many required configuration decisions
– unreliable third-party integration
– delayed background processing.
Each cause implies a different response.
The correct architecture may involve:
– workflow orchestration
– progressive onboarding
– precomputed defaults
– asynchronous imports
– better failure recovery
– a simpler product flow.
The metric defines the problem shape. Diagnosis identifies the mechanism.
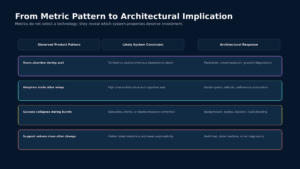
Figure 2. Different product patterns reveal different system constraints and therefore different architectural responses.
This is why architecture reviews should not ask only:
Can this design scale?
They should also ask:
Which observed product constraint requires it to scale in this way?
5. MEASURE THE SHAPE, NOT ONLY THE AVERAGE
Architecture is often guided by averages:
– average latency
– average order value
– average completion time
– average support volume.
Averages hide the system behaviour that architecture must address.
Tail distribution
A median latency of 300 milliseconds can coexist with a P99 of 12 seconds. The latter may drive abandonment and retries.
Cohort distribution
A healthy average activation rate can hide failure for one region, device type, customer segment, or payment method.
Sequence
Two products may have the same completion rate but different failure paths. One may fail early and clearly another may waste ten minutes before failing.
Variance
A process with an average completion time of two minutes may be harder to trust if outcomes range from ten seconds to thirty minutes.
Age
Queue depth alone is less useful than the age of the oldest business-critical item.
The architecture question often lives in the distribution.
Google SRE guidance recommends using user-oriented thresholds and multiple latency objectives because a good typical experience can hide an unacceptable long tail.[2]
The implication for product architecture is direct:
Measure the experience where users feel the system, not only where infrastructure is easiest to instrument.
6. PAIR TARGET METRICS WITH GUARDRAILS
A target metric creates pressure.
Pressure without a guardrail creates unsafe optimization.
Examples:
Target:
Increase checkout conversion.
Possible harm:
Accepting more risky payments, hiding failures, or delaying error disclosure.
Target:
Reduce support contacts.
Possible harm:
Making support harder to reach or leaving issues unresolved.
Target:
Increase automation.
Possible harm:
Automating cases that require judgment or failing silently.
Target:
Reduce infrastructure cost.
Possible harm:
Higher latency, weaker resilience, or more engineering toil.
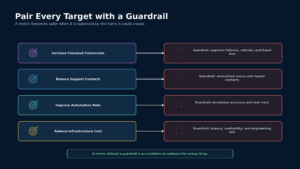
Figure 3. Every target metric should be paired with a guardrail that measures the harm created by over-optimization.
A metric pair creates a bounded objective.
Examples:
– conversion and payment failure rate
– automation rate and successful resolution rate
– deployment frequency and change failure rate
– cost per transaction and latency objective
– cache hit rate and age of served data.
DORA’s software delivery metrics use a similar balance between throughput and stability rather than rewarding deployment speed alone.[3]
The deeper principle is:
Do not optimize one side of a system property while pretending the other side is an implementation detail.
7. PRODUCT SLOS CONNECT EXPERIENCE AND RELIABILITY
Traditional service-level objectives focus on system behaviour such as:
– request success
– latency
– availability
– freshness.
Product teams often focus on task completion.
A product SLO connects them.
Example:
“99% of eligible customers can complete payment confirmation within five seconds, excluding explicit issuer challenges.”
This statement includes:
– who the user is
– what task matters
– what success means
– the time boundary
– legitimate exclusions.
It is more useful than:
“Payment API availability is 99.99%.”
An API can be available while the user journey fails because:
– one dependency returns incomplete data
– the state remains ambiguous
– the interface cannot explain the next action
– a later asynchronous step never completes.
Product SLOs encourage teams to measure the full experience.
Google SRE describes SLOs as shared reliability goals built from service-level indicators, with error budgets providing a way to balance reliability and development velocity.[2][4]
For architecture, the useful question is:
Which system boundaries must be visible to measure the user’s complete task?
8. LEADING AND LAGGING METRICS
Lagging metrics reveal completed outcomes:
– revenue
– retention
– completed orders
– refund rate
– customer satisfaction.
They are important but slow to diagnose.
Leading metrics reveal earlier movement:
– time to first successful use
– percentage of workflows completed without help
– queue age
– retry amplification
– percentage of requests using a fallback
– rate of ambiguous payment states.
Architecture decisions should identify both.
Example:
Decision:
Introduce parallel orchestration and graceful degradation for a support summary API.
Leading indicators:
– fewer sequential downstream waits
– reduced tail latency
– lower total-failure rate
– more partial but usable responses.
Lagging indicators:
– higher task completion
– fewer repeat support contacts
– improved satisfaction.
A technical improvement that moves no leading indicator is unlikely to move the lagging outcome.
9. METRICS CAN REVEAL THE WRONG BOUNDARY
Architecture boundaries should make important outcomes easier to observe and control.
Suppose a team cannot answer:
– how long an order takes from creation to fulfilment
– which service owns a stuck payment
– why a support workflow failed
– whether an automated case was actually resolved.
The problem may not be missing dashboards. It may be a fragmented business boundary.
A useful product metric can expose that fragmentation.
If measuring one user task requires joining logs, databases, and interpretations across ten services, the system may lack:
– a shared business identifier
– explicit state transitions
– an authoritative lifecycle
– end-to-end events
– ownership of the outcome.
Instrumentation pain can be architectural evidence.
10. THE ARCHITECTURE OF MEASUREMENT
Metrics themselves require architecture.
A reliable metric needs:
– a precise event definition
– a stable identifier
– consistent timestamps
– deduplication
– ownership
– schema evolution
– access control
– data-quality monitoring.
Consider “checkout completed.”
Does it mean:
– payment authorized
– payment captured
– order created
– confirmation page displayed
– fulfilment accepted?
Different teams may implement different meanings.
The metric becomes untrustworthy before the architecture discussion begins.
Every important product metric should have a data contract containing:
– business definition
– event or source
– inclusion and exclusion criteria
– owner
– latency and freshness
– known limitations
– versioning policy.
The measurement system is part of the product architecture, not a reporting layer added afterward.
11. AVOID PROXY INVERSION
A proxy metric represents something valuable indirectly.
Examples:
– daily active users as a proxy for engagement
– deployment frequency as a proxy for delivery capability
– cache hit rate as a proxy for performance
– support contact rate as a proxy for customer friction.
Proxy inversion occurs when the organization begins optimizing the proxy after forgetting what it represented.
A higher cache hit rate is not valuable if stale data harms users.
A lower support rate is not valuable if users cannot get help.
A higher event throughput is not valuable if consumers fall behind.
To avoid proxy inversion, document the causal chain:
We believe improving X will move Y because Z.
Example:
We believe reducing payment confirmation P95 latency will improve checkout completion because timeout-related abandonment is concentrated in that step.
This statement can be tested.
“Performance is important” cannot.
12. USE COUNTERFACTUAL THINKING
An improving metric does not prove the architecture caused the improvement.
Other changes may have occurred:
– traffic mix changed
– product copy changed
– seasonality shifted
– a large customer arrived
– one failing integration recovered
– pricing changed.
Architecture teams do not always need formal experimentation. They do need counterfactual discipline.
Ask:
– What would have happened without this change?
– Which cohort was exposed?
– Did the metric move where the mechanism predicts?
– Did leading indicators move first?
– Were unrelated segments unchanged?
– Did guardrails remain healthy?
This prevents architecture narratives from being written after the outcome.
13. SEGMENT BEFORE YOU GENERALIZE
A system may need different architectures for different workloads.
Examples:
– premium and free tenants
– high-value payments and low-risk payments
– real-time notifications and batch analytics
– regulated and standard regions
– interactive and background workloads.
A global metric can hide these differences.
Suppose overall queue latency is acceptable, but high-value financial events share the same backlog as low-priority analytics.
The average may look healthy while the architecture violates business priority.
Metrics should be segmented according to architectural boundaries:
– partition
– tenant
– processor
– region
– workflow type
– priority class
– client version.
Good segmentation reveals where isolation, routing, or specialization is required.
14. LINK METRICS TO REVERSIBILITY
Not every architecture decision deserves the same evidence.
Reversible decisions can be tested with lightweight metrics:
– cache policy
– one async workflow
– one read model
– one routing rule.
Hard-to-reverse decisions need stronger evidence:
– domain boundary
– tenancy model
– data ownership
– event partition key
– regional deployment model
– mandatory platform standard.
A practical review should ask:
– What is the expected metric effect?
– How quickly can it be observed?
– What would falsify the decision?
– What is the cost of reversal?
– Which data must be collected before committing?
Metrics are most valuable before irreversible decisions, not only after launch.
15. COMMON METRIC FAILURES
Vanity metrics
Large totals such as requests processed or events published create scale theatre without showing user value.
Unowned metrics
Everyone reviews the metric, but no team owns the mechanism that moves it.
Unstable definitions
The event or inclusion rule changes without versioning, making trends meaningless.
Global averages
Failures affecting one segment disappear inside a healthy aggregate.
Metric overload
Dashboards contain hundreds of signals, but no decision is tied to them.
Instrumentation after architecture
The system launches without the identifiers and events needed to test its assumptions.
No guardrails
Teams improve the target while harming quality, trust, or reliability.
No stop condition
The architecture continues to expand even after evidence shows limited value.
16. A METRIC-GUIDED ARCHITECTURE REVIEW
For each major design, answer:
Outcome:
Which user or business outcome matters?
Observed friction:
What evidence shows the current system constrains that outcome?
Behaviour:
What should users or internal teams be able to do differently?
Mechanism:
Which system capability could create that change?
Indicators:
Which technical and experience signals should move first?
Guardrails:
What harm could the design create?
Segmentation:
Which cohorts or workloads should be measured separately?
Reversibility:
How expensive is it to change direction?
Decision threshold:
What evidence justifies scaling, revising, or stopping?
This review is more useful than beginning with a target diagram.
17. EXAMPLE: SUPPORT AUTOMATION
Goal:
Resolve more support requests without manual intervention.
Weak metric:
Percentage of contacts handled automatically.
This metric can rise if the system closes cases prematurely or prevents escalation.
A stronger metric system includes:
Product outcome:
– issue resolved
– customer does not return for the same problem
– satisfaction remains acceptable.
Behaviour:
– users complete the guided flow
– users accept the answer
– users do not abandon and reopen the case.
Experience:
– time to resolution
– clarity of next step
– successful escalation when confidence is low.
System mechanism:
– evidence retrieval
– deterministic policy checks
– confidence thresholds
– human handoff
– durable case history.
Technical indicators:
– retrieval coverage
– unsupported-answer rate
– escalation latency
– tool failure rate.
Guardrails:
– repeat contact rate
– incorrect automation
– high-risk cases resolved without review.
The metrics do not merely evaluate the system. They define the architecture it requires.
18. EXAMPLE: MARKETPLACE CHECKOUT
Goal:
Increase completed paid orders.
Observed friction:
Abandonment rises during payment and inventory confirmation.
Metric chain:
Product outcome:
Paid order completed.
Behaviour:
Customer continues after clicking purchase.
Experience:
Confirmation is fast, unambiguous, and recoverable.
System mechanism:
Idempotent payment intents, inventory reservation, parallel orchestration, and explicit state transitions.
Technical indicators:
P95 and P99 confirmation latency, unknown payment outcomes, inventory conflict rate, and retry volume.
Guardrails:
Duplicate charges, overselling, refunds, and fraud loss.
This chain guides architecture far more effectively than “build a scalable checkout service.”
FINAL PERSPECTIVE
The best product metrics do not tell architects what technology to use.
They do something more valuable.
They expose:
– which user outcome matters
– which behaviour is blocked
– which system property influences it
– how success will be observed
– what harm must be prevented.
Architecture is then a testable theory about causality.
The enduring principle is:
Measure the user outcome, trace the mechanism, instrument the decision, and pair every target with a guardrail.
RESEARCH BASIS
[1] Kerry Rodden, Hilary Hutchinson, and Xin Fu, “Measuring the User Experience on a Large Scale: User-Centered Metrics for Web Applications.”
https://research.google.com/pubs/archive/36299.pdf
[2] Google SRE Workbook, “Implementing SLOs.”
https://sre.google/workbook/implementing-slos/
[3] DORA, “Software Delivery Performance Metrics.”
https://dora.dev/guides/dora-metrics/
[4] Google SRE, “SLO Adoption and Usage in Site Reliability Engineering.”
https://sre.google/static/pdf/SloAdoptionAndUsageInSre.pdf
[5] Google SRE Book, “Monitoring Distributed Systems.”
https://sre.google/sre-book/monitoring-distributed-systems/